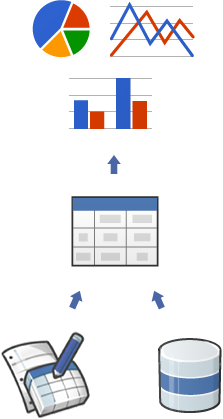
Google Charts?
Apparently Google exposed a free JavaScript library
that can help create nice charts.
But this is not an ordinary .js tool that you copy in your project:
you just reference it from google.com, like Google maps or adds, etc.
Terms and conditions are not quite clear who "owns" results of using the library,
some say the charts belong to Google. Your data, but Google's tool...
The tools is detecting old IE browsers (6-8) and using VML in that case, same as Raphael.js
Using Google Charts - Google Charts — Google Developers

"Charts are exposed as JavaScript classes, and Google Charts provides many chart types for you to use. The default appearance will usually be all you need, and you can always customize a chart to fit the look and feel of your website. Charts are highly interactive and expose events that let you connect them to create complex dashboards or other experiences integrated with your webpage. Charts are rendered using HTML5/SVG technology to provide cross-browser compatibility (including VML for older IE versions) and cross platform portability to iPhones, iPads and Android. Your users will never have to mess with plugins or any software. If they have a web browser, they can see your charts."
No comments:
Post a Comment