Friday, July 06, 2012

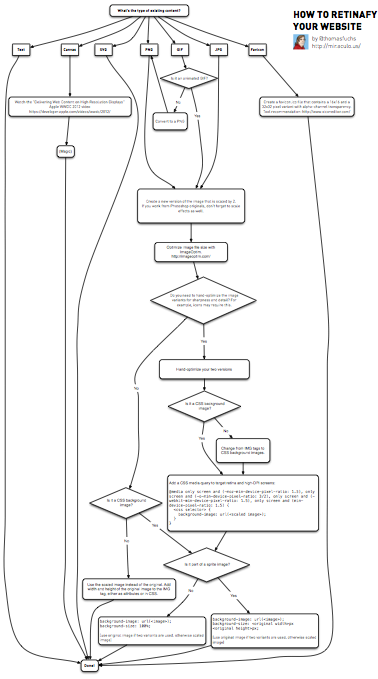
how to retina-fy website

mir.aculo.us JavaScript with Thomas Fuchs » Blog Archive » Flowchart: how to retinafy your website


Text is fine, Canvas and SVG.
GIF => PNG, * 2
JPG & PNG * 2
...

Room Re-Design

Young House Love - One young family + one old house = love.

Avatars.io

Avatars.io by chute:

"Every app needs avatars, we make it hassle-free
hosted user avatar service for your apps and sites"

Microsoft: Terrible Management Technique

The Terrible Management Technique That Cost Microsoft Its Creativity - Forbes:

“Every current and former Microsoft employee I interviewed—every one—
cited stack ranking as the most destructive process inside of Microsoft, 
something that drove out untold numbers of employees,” Eichenwald writes. 


“If you were on a team of 10 people, you walked in the first day knowing that, 
no matter how good everyone was, 2 people were going to get a great review, 
7 were going to get mediocre reviews, and 1 was going to get a terrible review,”
says a former software developer. 
“It leads to employees focusing on competing with each other 
rather than competing with other companies.”


@ Vanity Fair

Influence => Employee's Worth

Measuring An Employee's Worth? Consider Influence | Fast Company:

"Salesforce.com's Chatter system released a new feature this spring called Influencer. 
It purports to measure how influential you are within your company, by tabulating, for example, 
how your fellow workers respond to the items you post to your corporate social network"

LinkedIn = 20 x Facebook (Money Per User)

How LinkedIn Makes TWENTY Times More Money Per User Than Facebook - Business Insider:

"LinkedIn users spend an average of 18 minutes a month on the site. 
Facebook users spend 6.4 hours a month.


But LinkedIn gets $1.30 in revenue for every hour those users spend on site. 
Facebook: 6.2 cents."

Reminder: statistics could be, and often are, misused.

D3.js - Data-Driven Documents

D3.js - Data-Driven Documents


D3.js is a JavaScript library for manipulating documents based on data. D3 helps you bring data to life using HTML, SVG and CSS. D3’s emphasis on web standards gives you the full capabilities of modern browsers without tying yourself to a proprietary framework, combining powerful visualization components and a data-driven approach to DOM manipulation.

NVD3 Re-usable charts for d3.js

"Dark Matters" by PHD Comics

Dark Matters on Vimeo

Dark Matters from PHD Comics on Vimeo

Higgs Boson Explained by Cartoon

APOD: 2012 May 1 - Higgs Boson Explained by Cartoon


Higgs Boson Explained by Cartoon 
Illustrations Credit & Copyright: Jorge ChamPHD Comics

Learn Git in 15 minutes

Code School - Try Git

6 months to Nexus 7

The inside scoop on the Nexus 7 tablet (Q&A) | Internet & Media - CNET News:

"How long did it take you to pull the product together?
Brady: We started really working on it in January."

(the tablet was released in June)

That is 6 months of Google + Asus time.
And the reviews say that is the best tablet in the category.