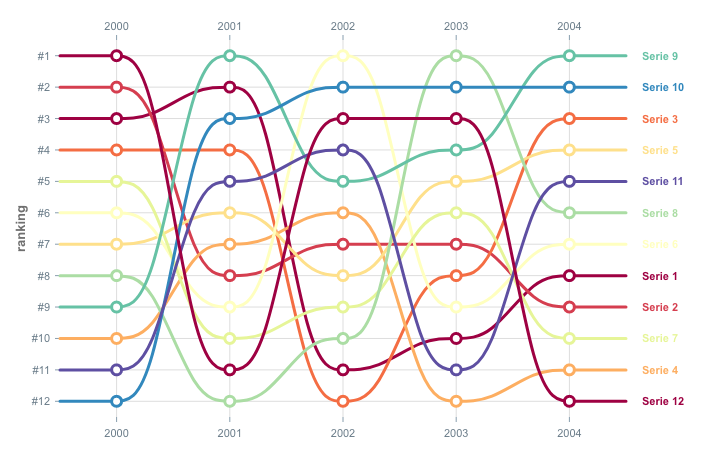
Sankey plot | the D3 Graph Gallery @d3 gallery
Whenever you want to show the flow of a quantity (such as energy or money) through a network of nodes you can use Sankey diagrams:
“A Sankey diagram is a directional flow chart where the width of the streams is proportional to the quantity of flow, and where the flows can be combined, split and traced through a series of events or stages.”


No comments:
Post a Comment